
📈 Upgrading Your Subscription
Live price charts, automated company filings, and a new perks page.
To read our full disclaimer, click here.
Over the past few weeks I’ve been working hard on the experience of being a Multibagger Ideas subscriber.
It’s part of the reason we now have over 500 paid subscribers who stick around to read the research every single week.
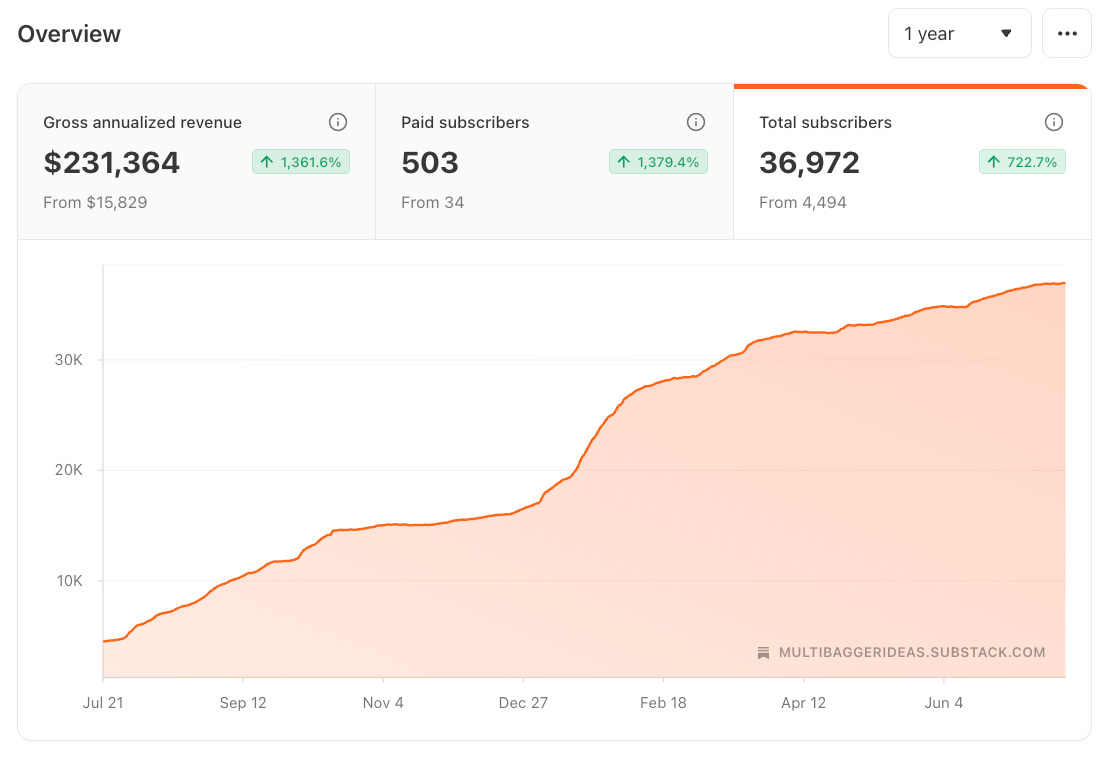
People don’t just subscribe here - they stay. And the way I keep it that way is by making the subscription better every month, not just publishing and hoping.
Today I’m sharing three new upgrades to your subscription.
All three are live right now…
1. The New Perks Page
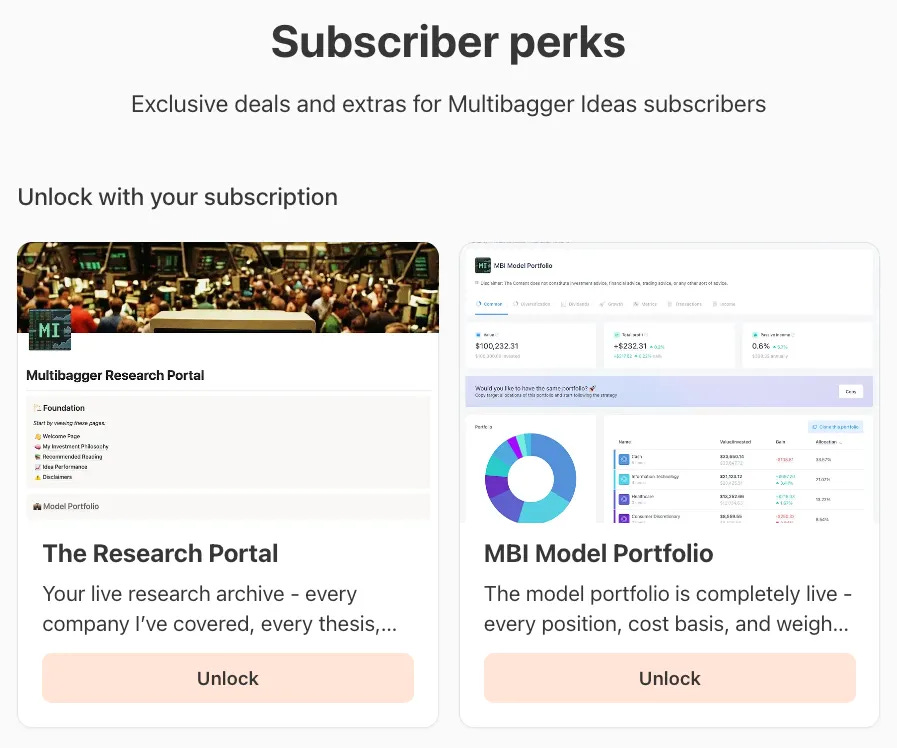
There’s now a single page where you can grab your links to everything included with your subscription - the live Research Portal and the MBI Model Portfolio.
No more digging through old emails to find the access links. One page, everything in one place:
2. Live Price Charts Inside Every Thesis
Every thesis in the Research Portal now has a live price chart embedded directly in the write-up.
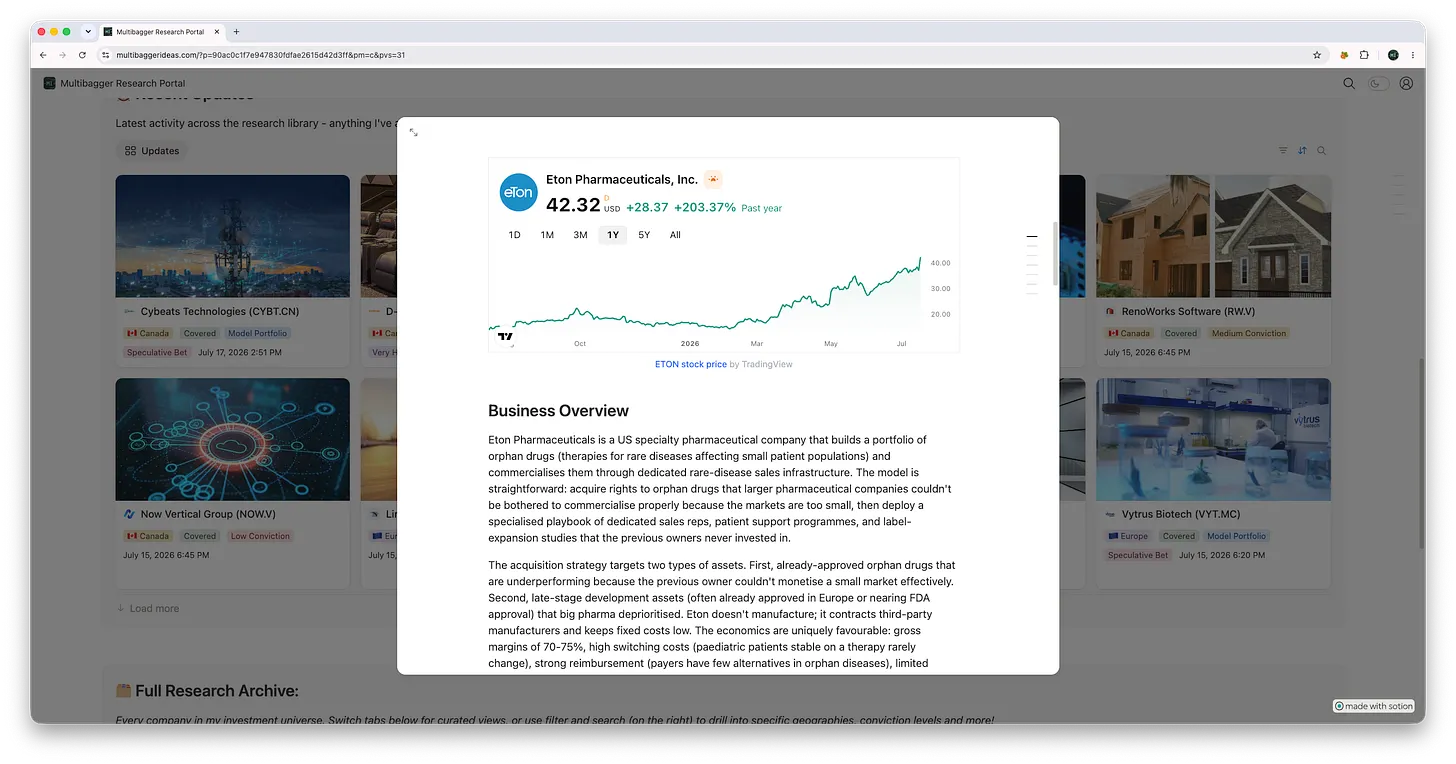
That means you can track the performance of a stock alongside the reasoning that put it there - as you read. No flicking between the portal and your broker to see where the price sits against the thesis. The chart updates itself; the write-up sits right underneath it.
Further down the page, it gets better…
3. Live, Automated Company Filings for Every Covered Company
This is the one I want to spend a minute on.
Every covered company in the Research Portal now has a completely live, automated feed of its major company filings and press releases - updated as they drop, ordered chronologically from the moment coverage began.
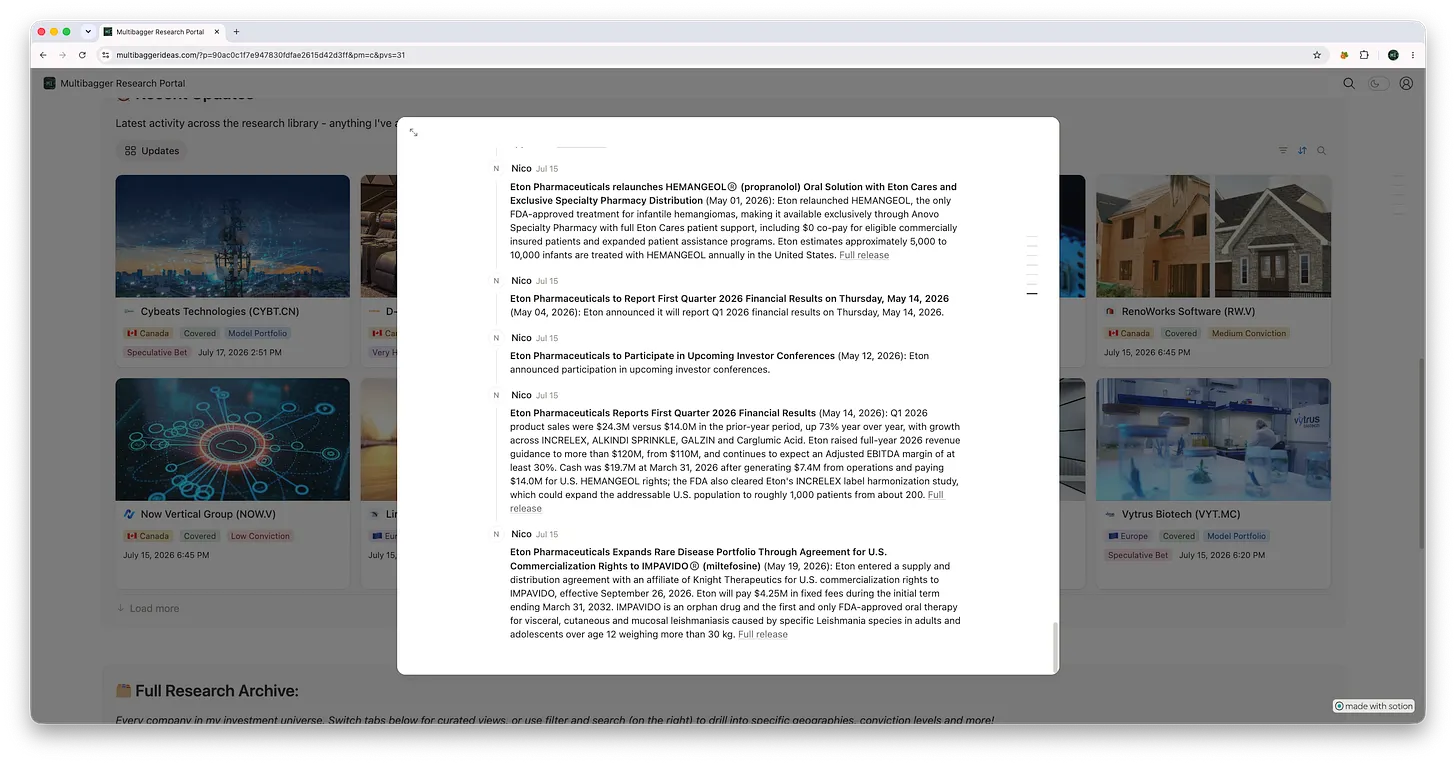
Now, it might not look like much in a screenshot.
But I honestly think this is one of the most important things I’ve built.
Here’s why.
A thesis is a claim about the future. The only way to judge it is to watch how the story actually develops - earnings print by earnings print, contract by contract, filing by filing. That evidence trail is exactly what’s always been hardest to assemble. It’s scattered across newswires, regulator websites, and months of old posts. Now it’s in one place.
Open any company in the portal and you get:
The live price chart at the top of the page
Links to every Substack post I’ve written on the company
A condensed, bullet-point thesis - easily digestible, no wall of text
A live, chronologically ordered feed of every major filing and press release since coverage began - so you can see how the story has developed over time, in order, with nothing missing
That last part is the piece I’ve always wanted as a reader.
When a company reports, you don’t just get the number - you can scroll back through the entire sequence of announcements that led there and check it against the original thesis.
Did management do what they said they’d do? Is the story on track, ahead, or drifting?
The evidence is right there, in order, next to the reasoning.
Every stock I’ve ever talked about, categorised and filterable, each with its thesis and its full paper trail attached. That’s what the portal is now.
The Watchlist Keeps Filling Out
One more thing worth flagging: the Watchlist tab in the Research Archive is filling out.
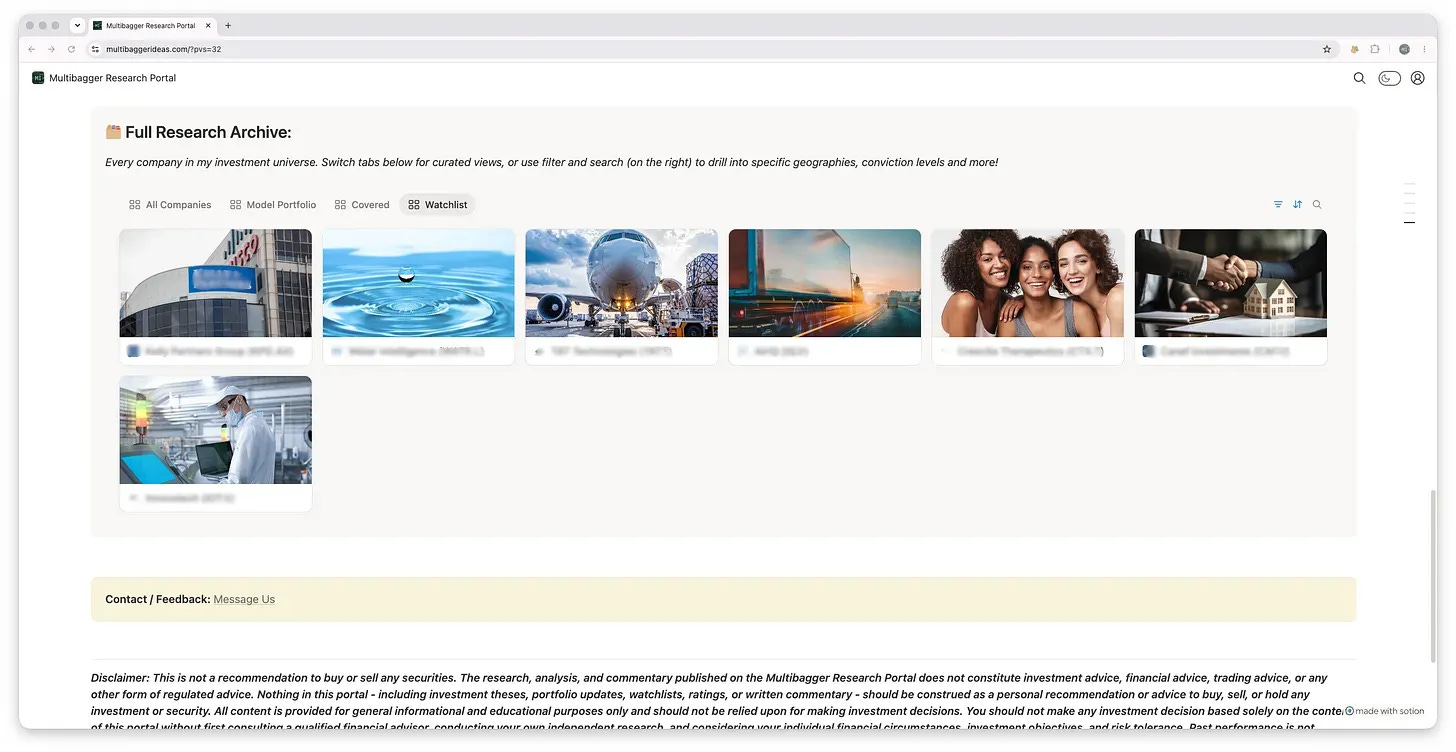
There are now 7 mini write-ups live - each one a proper research entry with the business, the numbers, and the reasoning that earned it a spot - and the list keeps growing as names clear the bar
All of This Is One Subscription
Everything above - the portal, the model portfolio, the live charts, the automated filings, the watchlist, and every write-up past and future - is included in a single subscription to Multibagger Ideas.
The yearly plan works out 33% cheaper than paying monthly.
As always, if you run into any issues accessing the portal or the perks page, just send me a DM and I’ll sort it out for you personally.
Thanks for your support - it’s the reason any of this gets built.
Nico
Disclaimer: The Content does not constitute investment advice, financial advice, trading advice, or any other sort of advice. Nothing in this newsletter should be construed as a personal recommendation or advice to buy, sell, or hold any investment or security. All Content is provided for general informational purposes only and should not be relied upon for making investment decisions. You should not make any investment decision based solely on the Content without first consulting with qualified financial advisors, conducting your own research, and considering your individual financial circumstances, investment objectives, and risk tolerance. To read our full disclaimer, click here.
I wonder how a subscriber might use the live filings and price chart to evaluate a company's performance against its thesis, like tracking a stock's price movement in response to a major filing or earnings report.