
My Free Multibagger Screener (Updated)
A free multi-factor ranking system for micro-caps - and every stock it's finding right now across the US, Canada, and Europe.
To read our full disclaimer, click here:
If you are NEW, check out my Complete Guide to Finding Multibaggers.
Every investor wants a shortcut.
A magic filter that spits out the next 100-bagger while you sleep.
I’ve spent years using screeners. They’ve led me to some of my best ideas. But they’ve also taught me something important:
Screeners are a starting point, not a destination.
Today I’m sharing an updated version of my multibagger screener - completely free - along with some honest thoughts on what screens can and can’t do for you.
I’ve rebuilt the system from scratch. New platform, new ranking methodology, and three separate regional screens covering the US, Canada, and Europe.
For subscribers, I’m sharing the full top 25 ranked stocks from each region. For everyone else, you’re getting the top 5 from each - plus the complete methodology so you can build your own.
But before that, let me be upfront about something: I am not a quant. I don’t worship at the altar of factor models. I don’t think you can automate your way to multibaggers.
However I do think a well-designed screen can get you into the right universe - and from there, the real work begins.
The Case For Screening
Screens can work. Here’s why I still use them:
They filter noise. There are thousands of publicly traded companies. Screens narrow the universe to something manageable.
They enforce discipline. When you define your criteria upfront, you avoid chasing stories that don’t fit your framework.
They surface the overlooked. Small and micro-caps get zero analyst coverage. A well-designed screen can surface names you’d never stumble across otherwise.
They’re repeatable. Run the same screen monthly, and you’ll catch businesses as they enter your criteria - the ones just hitting an inflection point.
For idea generation, especially in the small-cap space, screens remain one of the best tools available.
Why Micro-Caps Are Different
Here’s the thing: for large caps, screening is almost pointless. Every metric is picked over by hundreds of analysts with Bloomberg terminals and better data than you.
But small and micro-caps? That’s different.
These businesses are structurally ignored by institutions. Fund mandates prevent them from buying. Liquidity constraints keep them off the radar. Analyst coverage is sparse or non-existent.
That means inefficiencies persist.
A screen that surfaces a $50M company with 25% ROIC and 30% growth isn’t competing against Goldman Sachs. It’s competing against almost no one.
For idea generation in small and micro-caps, screening still works in my opinion.
Not as a magic formula. But as a starting point for real research.
The Limits of Screening
But here’s the uncomfortable truth: the best multibaggers often don’t screen well.
Why?
Qualitative moats don’t show up in data. A founder’s capital allocation brilliance, a unique culture, a regulatory tailwind - none of these appear in a screener.
Transformation stories get filtered out. A business tripling margins won’t show high historical ROIC. A turnaround won’t pass profitability filters.
Narrative complexity breaks formulas. The most asymmetric opportunities usually require context that spreadsheets can’t capture.
Management quality is invisible. Insider ownership shows up, but alignment, integrity, and long-term thinking don’t.
I’ve written about companies at Multibagger Ideas that would never have appeared on any screen - and some of them have been my best performers. That’s important to remember as you read the rest of this post.
My Multibagger Screen
Here’s a mistake I see constantly: investors build screens with “perfect” metrics baked in.
The result? A screen that returns 3 stocks - all of which everyone already knows about.
My approach is different: cast a wide net, then do the work.
I use a deliberately rough screen. Simple filters that get me into the right universe - small caps with decent returns and reasonable liquidity - without filtering out the interesting edge cases.
Here are the filters:
Exclude Utilities and Financials - different economics, harder to compare with the rest of the universe
Market capitalisation below $300 million - this is where inefficiency lives
Stock price above $0.10 - avoiding penny stock noise
20-day average volume above 10K - you need to be able to actually buy and sell
Return on equity over the last 12 months better than the industry median - a loose quality filter that still lets through turnarounds and edge cases
That’s it. Nothing exotic. The goal isn’t to find the “perfect” stock. It’s to build a universe of small, profitable businesses that most investors are ignoring.
But the screen alone doesn’t tell you which stocks to look at first. That’s where the ranking system comes in.
The Ranking System
On top of the screen, I run a multi-factor ranking system that scores every stock passing the filters. Think of it as a way to sort the output - putting the most interesting names at the top of the list.
The system scores stocks across five dimensions, each weighted based on what I think matters most for finding multibaggers:
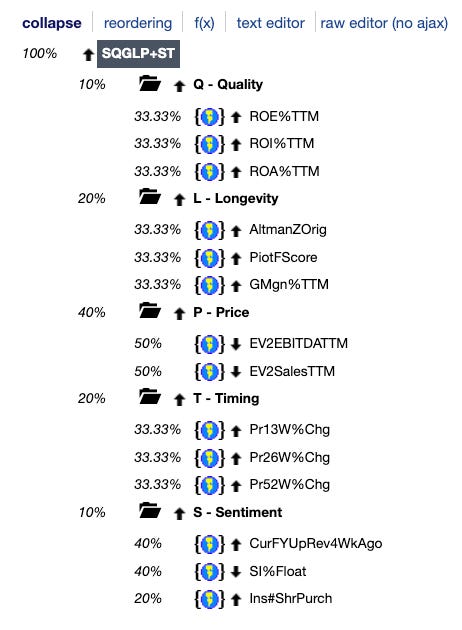
If you’re a regular reader, you’ll recognise this as a quantitative expression of the SQGLP framework I use for all my analysis - just translated into factors that a ranking system can measure.
Does It Actually Work?
I backtested the ranking system over a 10-year period from March 2016 to February 2026. The stocks passing the screen are sorted into 10 buckets based on their composite score. Bucket 10 is the highest-ranked. Bucket 1 is the lowest.
The results show a near-perfect monotonic relationship between rank and returns.
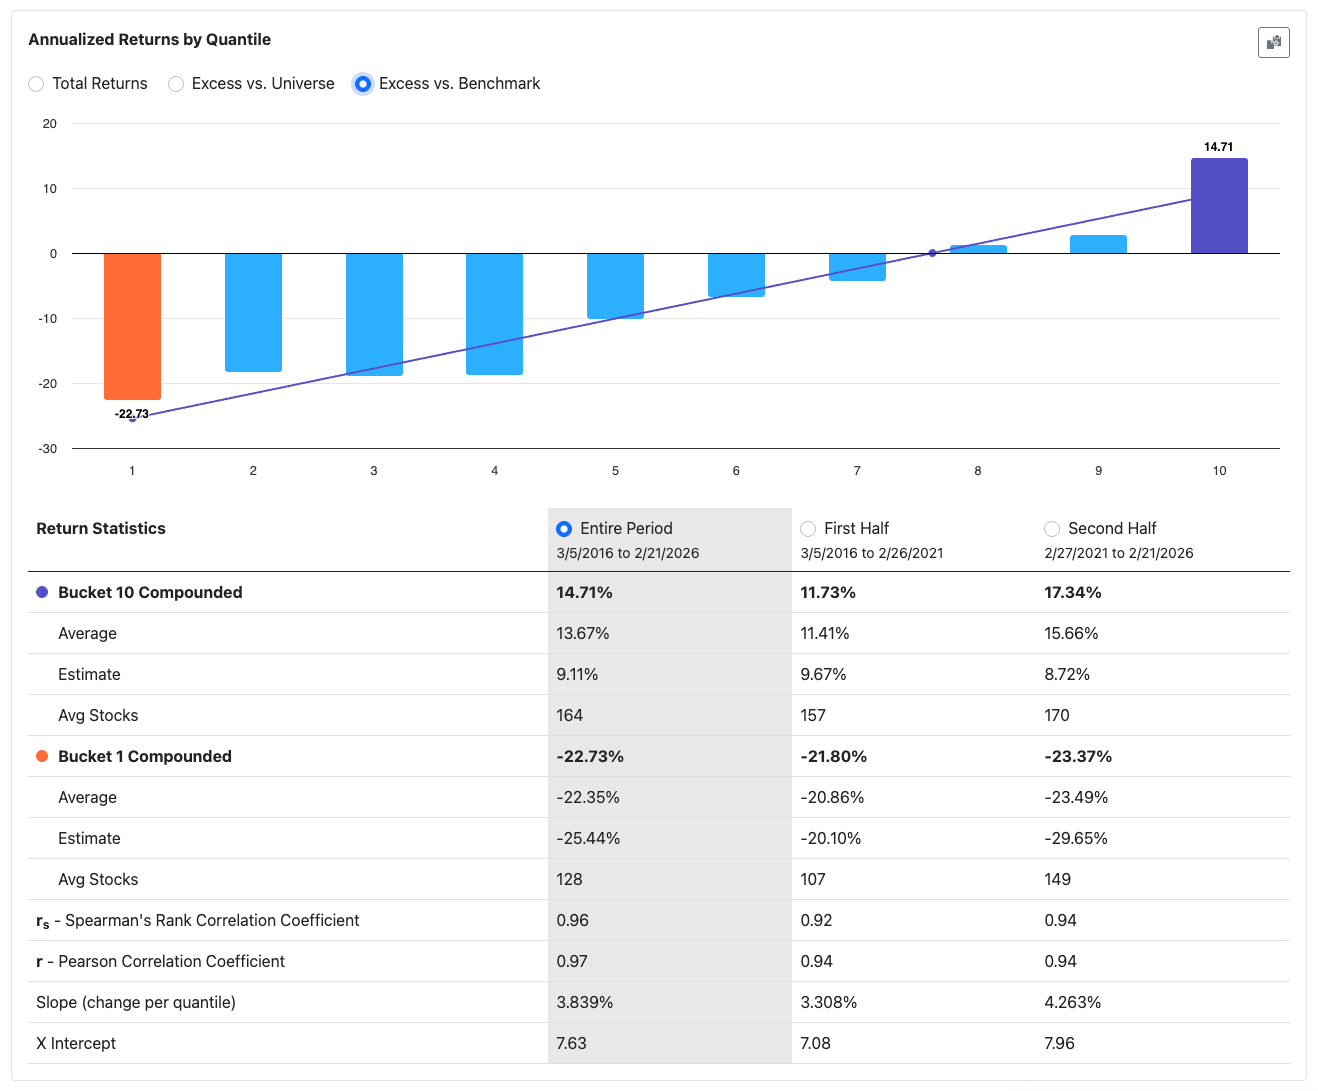
The top bucket (Bucket 10) compounded at +14.71% annualised excess returns versus the benchmark. The bottom bucket (Bucket 1) compounded at -22.73%. That’s a spread of over 37 percentage points per year between the best and worst-ranked stocks.
The Spearman rank correlation coefficient was 0.96. The Pearson correlation was 0.97. For context, anything above 0.80 is considered very strong. These numbers tell you the ranking system has genuine discriminating power - stocks ranked higher consistently outperformed stocks ranked lower.
The slope was 3.84% per quantile - meaning each step up in rank added roughly 3.84% in annualised returns.
And this held across time periods. The first half (2016-2021) showed 11.73% excess for the top bucket. The second half (2021-2026) showed 17.34%. The system actually got better in the more recent period.
But here’s my honest take: backtests are backtests.
I’m sharing these numbers because they show the ranking system has discriminating power - not because I think you should blindly follow the output.
A ranking system can tell you where to look. It can’t tell you what to buy.
Proof It Finds the Right Names
Here’s something that gave me real confidence in this system.
When I ran the Canadian screen back in February 2025, here’s what it returned:
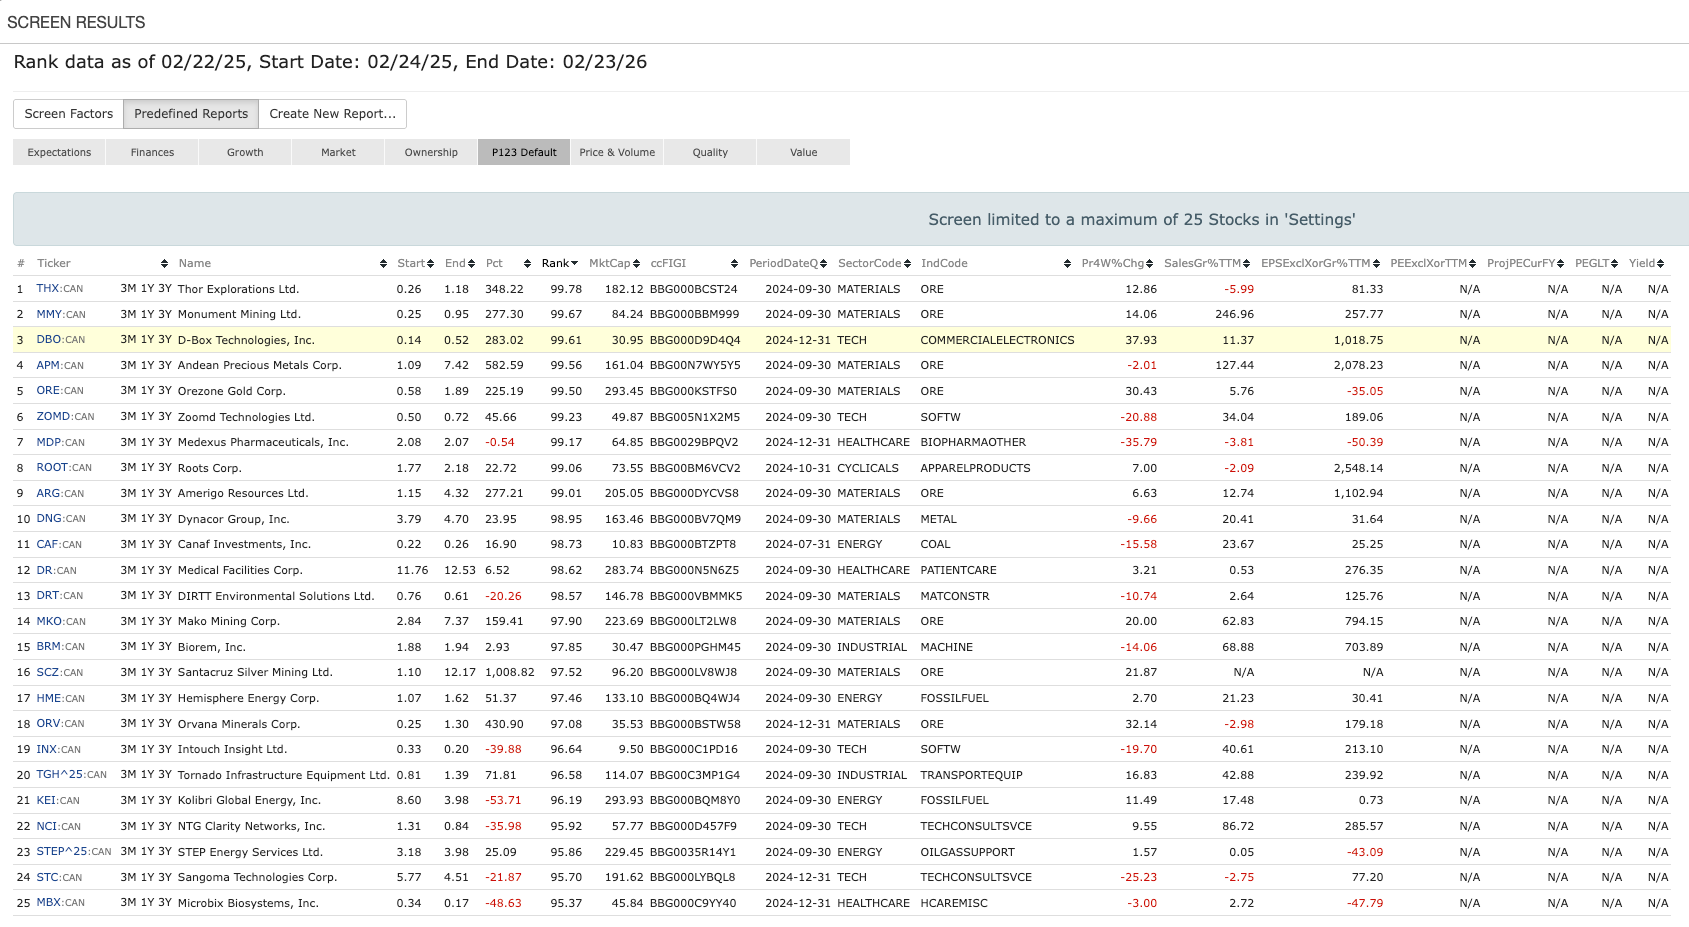
Look at row 3. D-Box Technologies at C$0.14, ranked 99.61.
I didn’t find D-Box through this screen. I found it independently at C$0.30 and wrote it up for subscribers. Since then, it’s become the biggest multibagger found on this page.
But the screen found it first. At less than half my entry price. Before I even knew the company existed.
Now, I want to be honest here. This is cherry-picking.
The February 2025 Canada screen was the single best year out of any of the ten years I’ve run across all three regions.
Of the 25 stocks on this list, 9 at least doubled within a year. That’s 36% of the screen producing multibaggers - Thor Explorations up 352%, Andean Precious Metals up 568%, Santacruz Silver up over 1,000%, Orvana Minerals up 446%.
That’s not normal. That’s not what you should expect every year.
But here’s what matters to me: the screen ranked D-Box in the top 3 out of hundreds of Canadian micro-caps. It identified the exact type of business I spend weeks researching manually - a cheap, profitable, overlooked company with improving fundamentals. The overlap between what the numbers surface and what deep qualitative work confirms is real.
Most stocks at the top of the list won’t be multibaggers. But the system is fishing in the right pond - and that’s all you can ask of a screener.
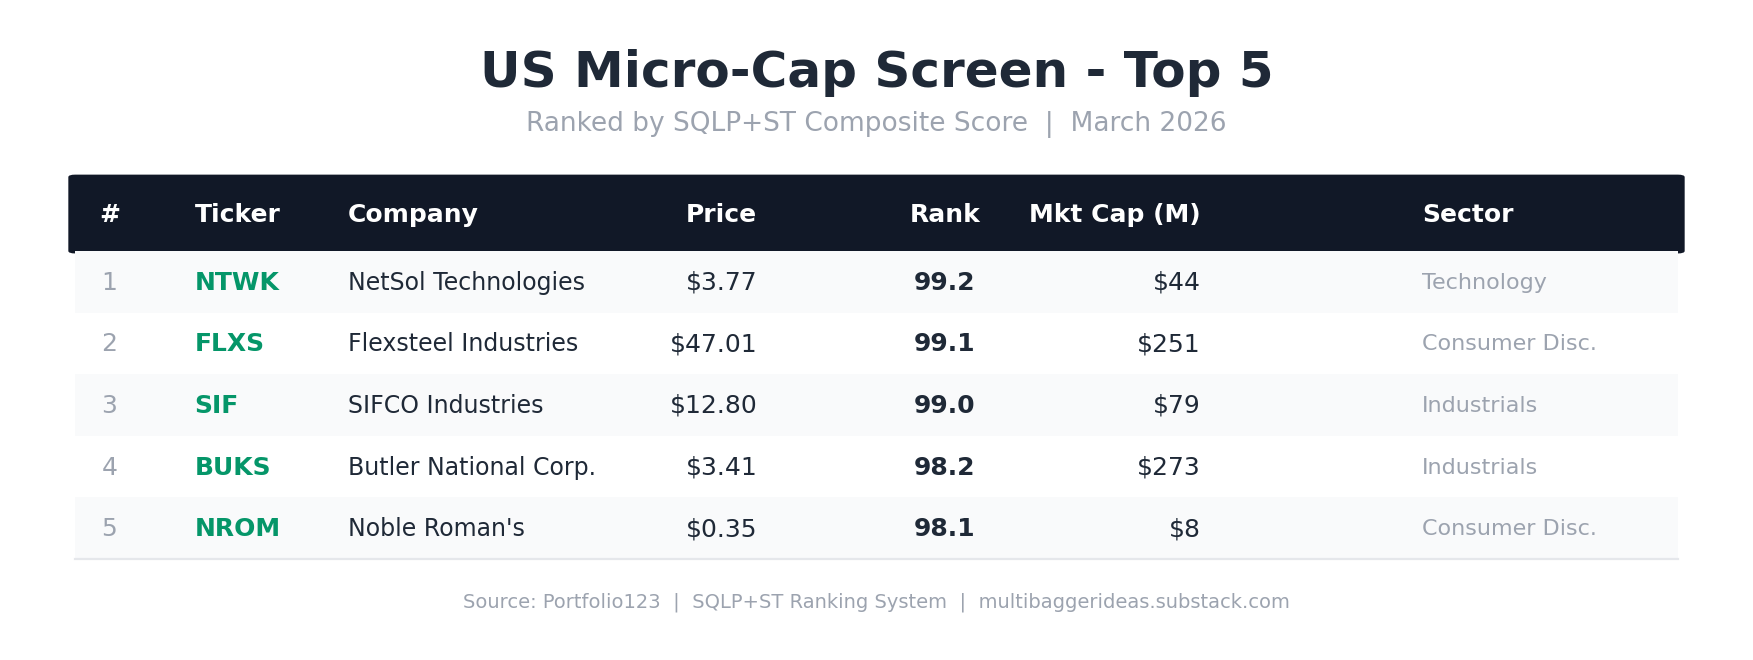
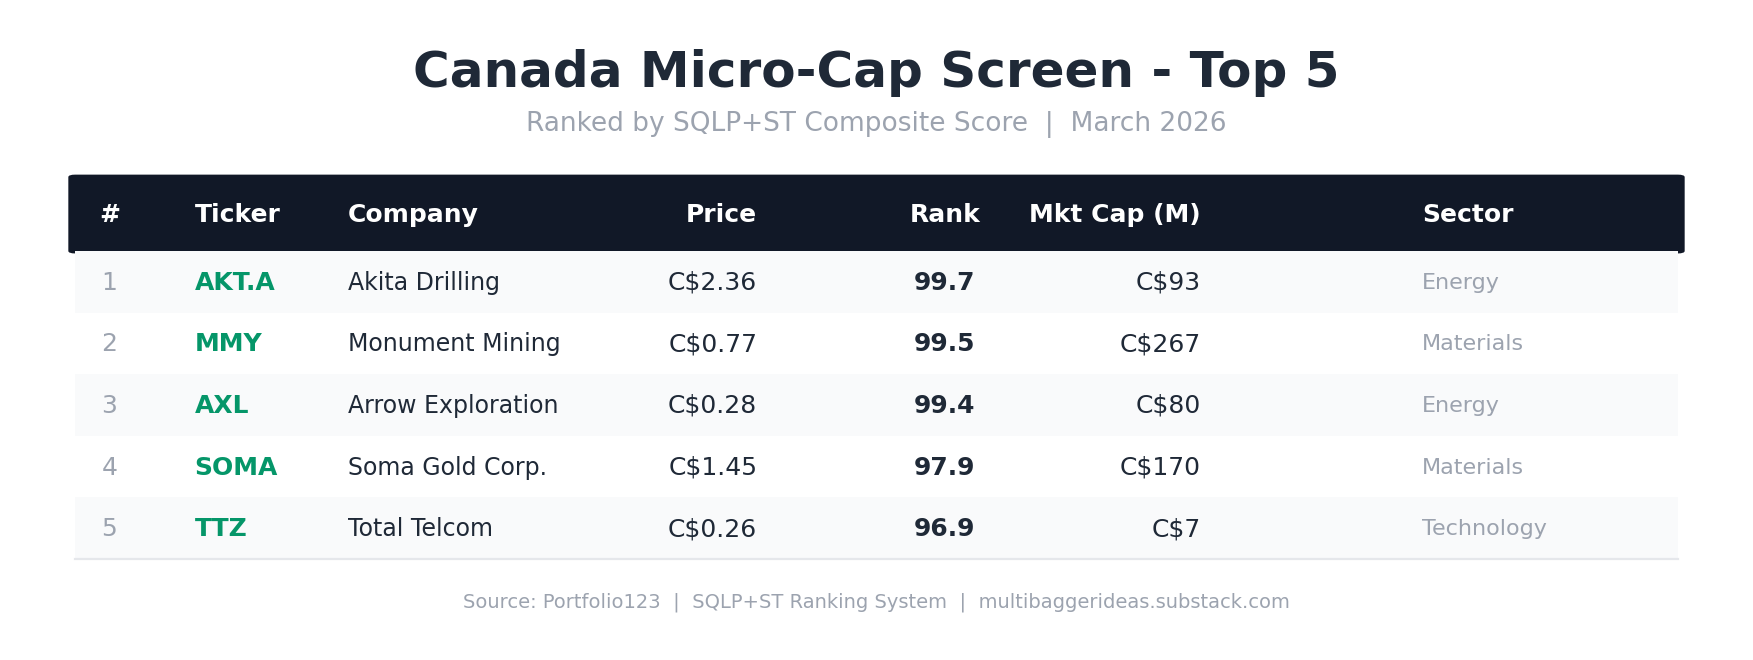
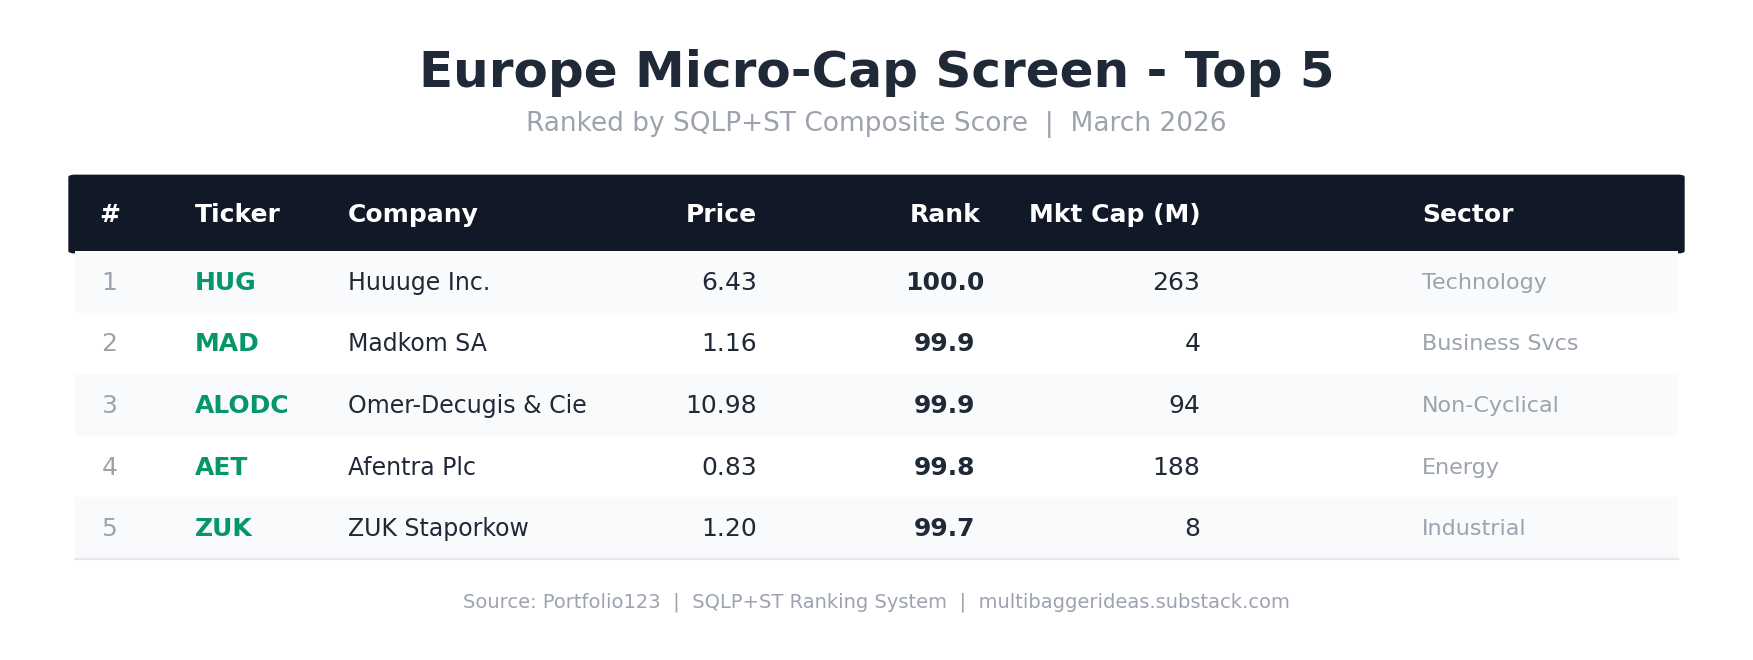
The Top 5 From Each Region
Here’s a preview of what the screen is surfacing right now. The top 5 stocks from each region, ranked by the composite score.
For paid subscribers, I'm sharing the full top 25 from each region below.